An overpressure event at the end of a hydraulic press return stroke may last only a few milliseconds. By the time the machine has tripped, pressure has decayed and the next cycle may run normally. A stored maximum of, say, 280 bar might confirm that the limit was crossed, but it cannot show whether the rise began at the cylinder, pump outlet or return path.
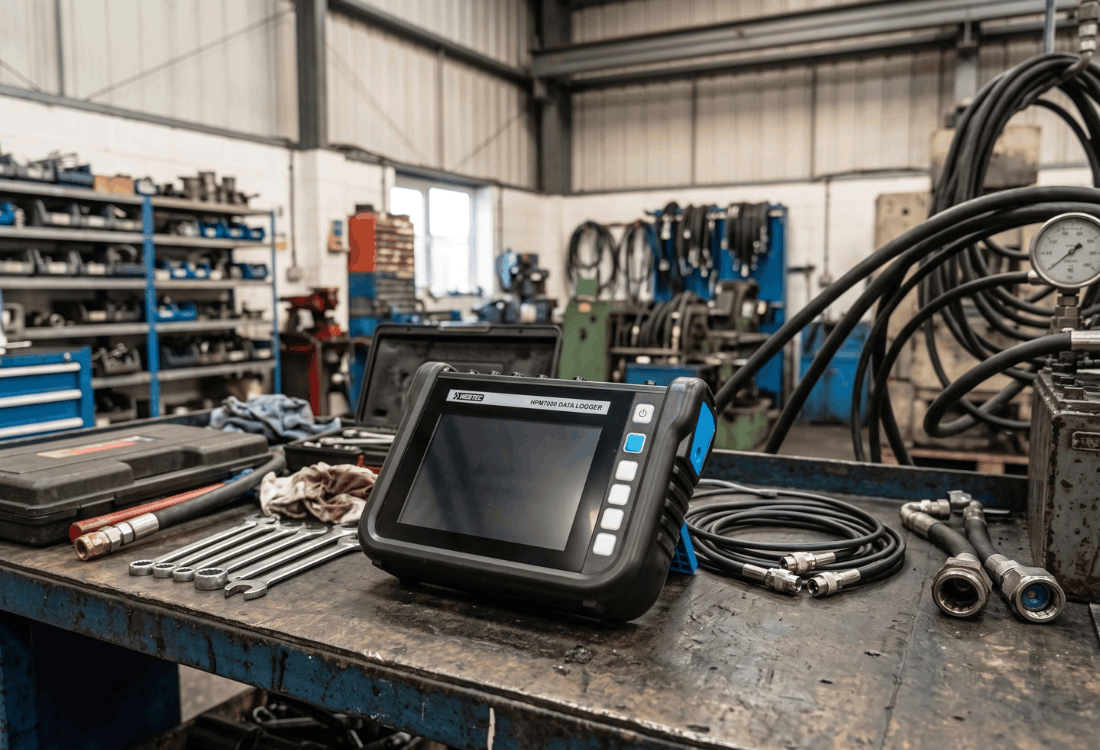
So, how do we reconstruct it? We need the pump, actuator and valve signals on one clock, preserving the few milliseconds in which the sequence unfolds. The Webtec HPM7000 hydraulic data logger supplies that shared time base. Its trace lets us follow the event from controller command, through valve movement and circuit pressures, to the area that deserves the next physical test.

At the end of the return stroke, valve current marks when the controller energised the solenoid, while spool feedback marks when the valve’s internal flow path actually changed. Aligning both signals with pump-outlet pressure places the rise before, during or after the valve transition.
Suppose the current rises at 842 ms, pressure starts climbing at 849 ms and spool feedback follows at 854 ms. In this case, the transient has begun while the valve is still moving. Where pressure remains steady until after 854 ms, the investigation moves to the hydraulic path created by the completed shift. When direct spool feedback is unavailable, a limit switch or PLC flag can give you the cycle reference, with pressure and flow showing how the circuit responded.
Pressure relationships around the valve and cylinder
Once the valve transition has been placed on the timeline, four pressure channels show where the pressure rise first appeared: pump outlet, rod-end port, cap-end port and valve return line. Adding flow establishes whether the platen was still moving when the pressure began to rise.
A rod-side peak that leads the pump trace is consistent with the moving platen compressing oil as it decelerates. A cap-end rise followed by a return-line rise directs attention towards restriction in the exhaust path. Where pump-outlet pressure rises first, the pump-side circuit and pressure-control response become the next area to investigate. These timing relationships narrow the component test that follows.
Hydraulic data logger capture duration and sensor bandwidth
As an intermittent trip may only appear once in several hundred press strokes, the hydraulic data logger needs to remain on the machine long enough to catch it. Webtec specifies up to 16 million measured values per test, a logging interval from 1 ms and as many as 48 Webtec CAN channels on the base model. That combination allows the HPM7000 to cover an extended production run while preserving the timing around a short pressure event.
Resolving an 8 ms spike requires fresh sensor data at intervals comfortably shorter than the event, so pairing the 1 ms logger setting with fast-response transducers and a suitable CAN update rate will give you multiple points across the pressure rise, peak and decay. The trace then has enough definition to show which channel moved first and how much time separated each change.
The pressure connection forms part of the same timing chain. Short, direct test connections preserve the shape and arrival time of the pressure pulse. Where snubbers or longer hoses are required, using comparable internal volumes and damping across the channels creates a consistent response. Differences in trace timing can then be related confidently to events within the circuit.
Investigating your pressure spike
Your circuit diagram and a description of where the trip appears in the machine cycle give us the context for HPM7000 hydraulic pressure testing on your machine. We can then position pressure, flow and control-signal channels around the relevant parts of the circuit and set a recording window that follows several normal strokes into the fault.
The resulting trace gives our engineers a shared view of what changed, in what order and where the next component-level test should concentrate. If you would like to find out more, please call one of our specialists today on 01353 721704. , or click here to send us a message.